Asia High Yield: A more diversified landscape

Crystal Chan - Head of Investment Specialist, Principal Hong Kong
Key takeaways:
- Different from the old times when China’s presence dominated the space, Asia high yield market has evolved to be more diversified regarding country composition.
- The income potential of China, India and Indonesia high yield markets remained attractive, together with the relatively high level of spread in China high yield (the term 'HY' refers hereafter to high yield) market, that offers opportunities for excess return generation from spread compression.
Asia high yield is more than China
The USD Asia high-yield bond market was valued at over $300 billion before COVID hit in comparison with the US$1.8trn US market for this asset class. On average, Investors were offered a spread of 250 basis points on top of the U.S. in the past 10 years to take up a smaller market size and any potential market inefficiencies.
Different from the old times when China’s presence dominated the space, Asia high yield market (represented by ICE BofA Asian Dollar High Yield Index) has evolved to be more diversified regarding country composition, especially after the reshuffling led by a collapse in China high yield market in the past two years.
Market value and number of issues in major Asia corporate HY markets 1
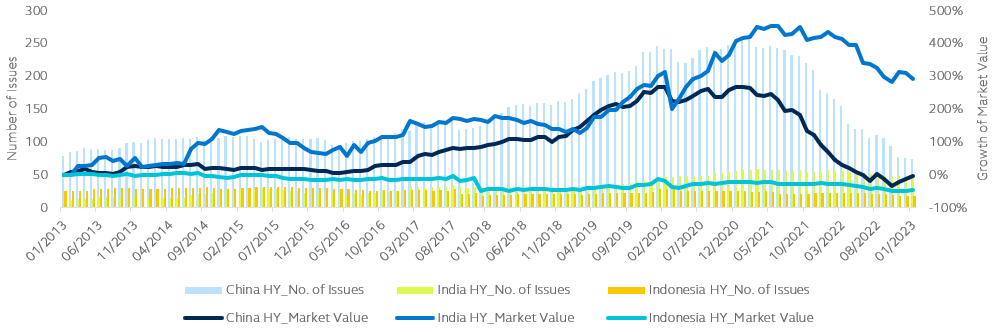
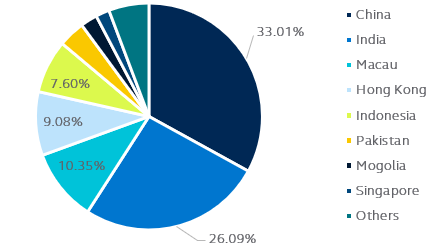
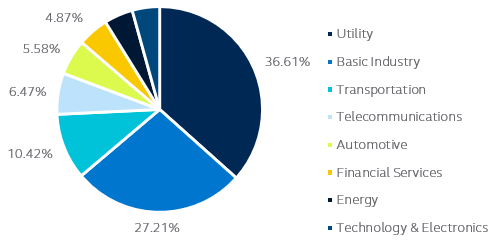
The overall Asia high yield market is now less exposed to concentration and idiosyncratic risks. The country weight of China shrunk drastically from as high as 60% at the beginning of 2021 to 33% at the end of 2022. The rest of Asia high yield market was comprised of India (26%), Macau (10.3%), Hong Kong (9%), Indonesia (7.6%) and other smaller players.
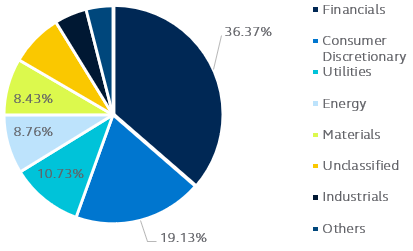
In terms of sector, financials (including the real estate sector) accounts for the largest share at 36%, followed by consumer discretionary (19%), utilities (10.7%), energy (8.7%), materials (8.4%) and others.
Asian high yield index - Country breakdown 2
Asian high yield index - Sector breakdown 2
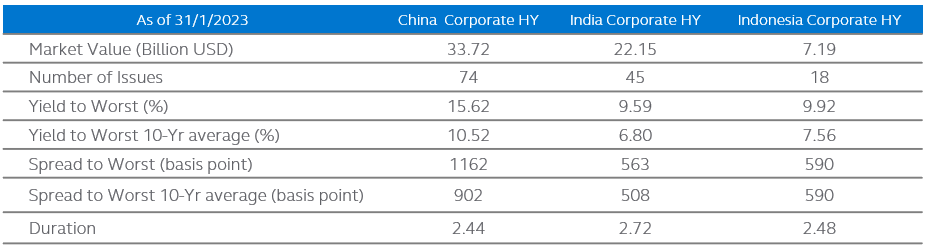
An overview of China, India and Indonesia corporate high yield markets
1) China
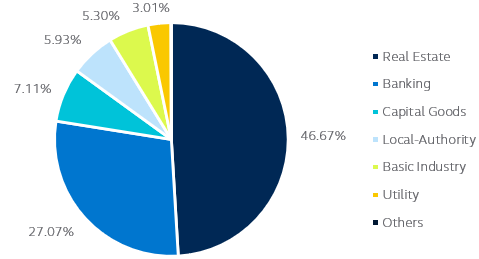
The real estate sector dominated the China corporate HY market with a weight of 46.6% as of the end of January 2023. The sector continued to stay in a discounted zone while its yield to worst is still close to 25%. The banking sector ranked second in terms of market share (27%), which had a lower yield and relatively higher duration among the major sectors.
China corporate HY market sector breakdown by weights 3
China corporate HY Yield & duration of major sectors 3
Since late 2022, we have seen a policy U turn in the form of a series of credit support for the real estate sector. The worst time of the sector in the current bout is likely behind us, with market sentiments turning upbeat in recent months. What lies ahead could be the recovery story following the country’s drastic pivot from a zero covid policy to reopening. The dismantling of covid restrictions may facilitate the sales of property. With an improving macro environment and cheaper valuation, the real estate sector may continue to rebound. However, the previously prevalent belief that the central government will come to rescue at times of crisis has been shaken. Going forward, a higher borrowing cost and stricter scrutiny on fundamentals for developers may become the new normal.
2) India
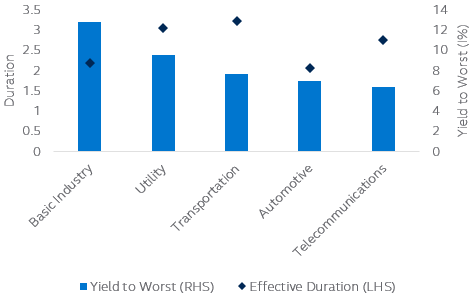
In India corporate HY market, the two major sectors are utility and basic industry which accounted for approximately 36% and 27%, followed by transportation at 10%. Compared to China, India’s market is less concentrated in a single sector and comprised of a different set of components, providing more diversified bond choices for investors eyeing Asia high yield market.
India corporate HY market sector breakdown by weights 4
India corporate HY Yield & duration of major sectors 4
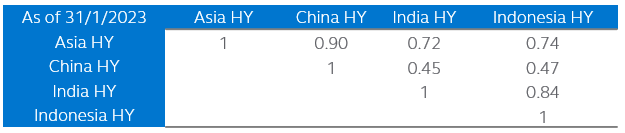
In fact, the 10-year return correlations between China HY market and that of India and Indonesia were below 0.5, suggesting a possibly diverging return dynamics at times of negative events in a single market and hence achieving diversification.
10-year return correlation table 5
The renewable energy sector in India is gaining greater attention from investors thanks to its structural growth potential. While being the third largest energy-consuming country in the world, India aims to achieve net zero in 2070 and has embarked on energy transition projects to gradually shift its energy consumption from fossil fuel to renewable energy, such as achieving 50 percent cumulative electric power installed by 2030 from renewables. According to REN21 Renewables 2022 Global Status Report, India stands 4th globally in renewable energy installed capacity (including large hydro), 4th in wind power capacity & 4th in solar power capacity in 2021 6. The sustained growth of renewable energy consumption, coupled with policy support and ongoing urbanization, may continuously foster the demand for the sector.
The basic industry sector in the space provides the highest yield to worst of 12.8% with a relatively lower duration of 2.2. The basic industry sector typically includes companies involved in the production and manufacturing of raw materials, such as natural resources, commodities and chemicals, which are the inputs in the production processes of other industries like manufacturing and construction. Thus, the demand for the sector’s products closely correlates to the overall economic growth of the country. The growth outlook of the country outshines China with a much younger composition of its population. With a projected annualized GDP growth rate exceeding 6% in 2023-2027, India’s GDP size is estimated to reach 5.4 trillion U.S. dollars and surpass Japan to become the world’s third-largest economy in 2027. The bright picture of the Indian economy may set the stage for stable growth of basic industry companies going forward.7
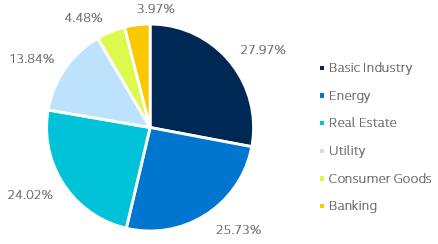
3) Indonesia
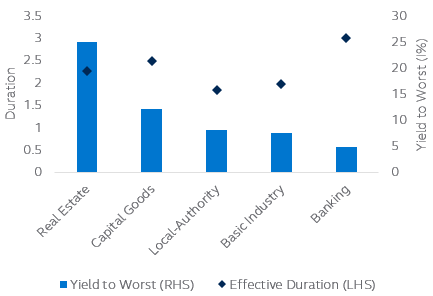
In Indonesia, the top three sectors are basic industry, energy and real estate. Each of the sector constituted roughly one-fourth of the total market share. Similar to China, the YTW (the term “YTW' refers hereafter to yield to worst) of the real estate sector outstripped others at 17%.
Indonesia corporate HY market sector breakdown by weights 8
Indonesia corporate HY Yield & duration of major sectors 8
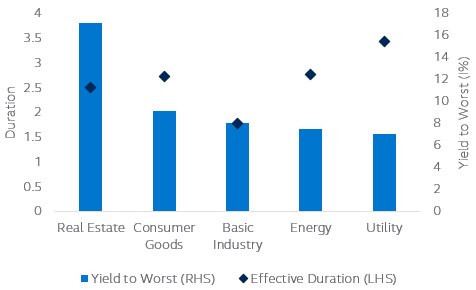
The commodity sector plays a significant role in the economy, which accounts for a substantial portion of the country’s exports and contributes to overall economic growth. Indonesia is rich in natural resources, such as coal, crude oil and natural gas, which makes the country one of the world’s largest exporters of these products. With China being one of the major importers in Indonesia, the country’s economy and export-oriented sectors are expected to benefit from the economic recovery in China in the year ahead. However, the sector also faces challenges of looming recession risks in the US and EU which might pressure the commodity prices due to weakening demand when economic activities contract.
In addition, investment opportunities also exist in the renewable energy sector. The government has set ambitious sustainability targets and pledged to meet net zero emissions by 2060. For example, the government targets to lift renewable energy shares in total electricity generation to 23% and 31% by 2025 and 2050, compared to 14% in 2021. According to the International Renewable Energy Agency, the endowment of ample geothermal and hydropower potential as well as renewable resources like solar, wind and ocean have put Indonesia in a unique position to develop sustainable energy.9
Statistics of major Asia high yield markets 10
All in all, the market size of China corporate high yield is 52% and 3.7 times larger than that of India and Indonesia. The market size of China HY market has scaled down to roughly where it was a decade ago, meanwhile, the size of India corporate HY market soared by around 3 times during the same period.
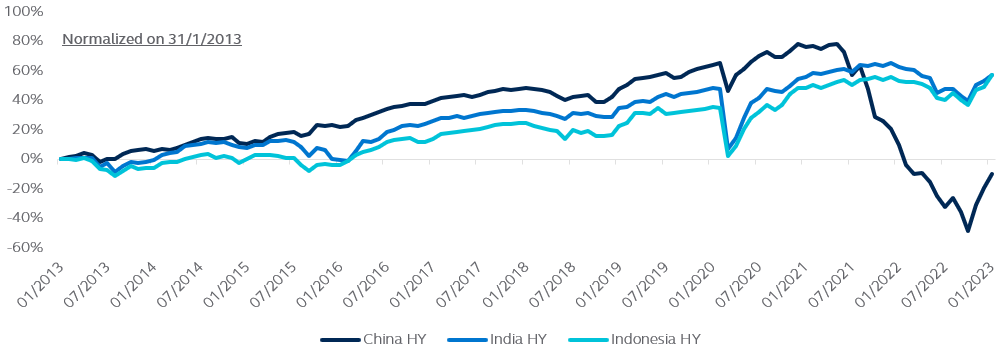
China corporate HY market has flipped from a consistent outperformer to a noticeable underperformer compared to its India and Indonesia counterparts since mid-2021. Such development highlights the concentration and political risks associated with one single sector – real estate. From its peak in mid-2021 to the end of January 2023, the China high yield real estate sector 11 registered a drawdown of 53.8%, which was largely in line with the performance of China high yield market that dropped by 49.8% in the same period.
Cumulative return in major Asia corporate HY markets 12
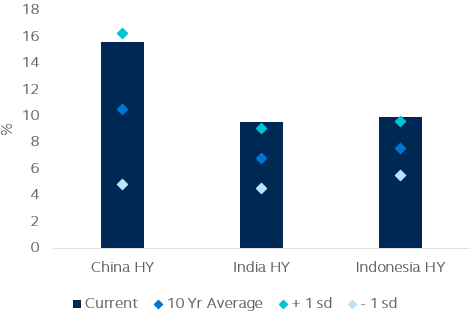
After experiencing a rapid rebound from the fourth quarter of 2022, China, India and Indonesia HY markets were still undervalued in terms of yield to worsts, which sat at levels around one standard deviation away from their 10-year averages.
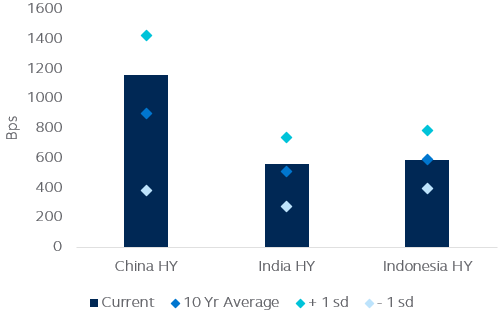
With respect to credit spread, while the China HY market’s spread still hovered above 1100 bps (260 bps high than its 10-year average), the spreads in India and Indonesia HY markets have returned to average levels under a more stabilized backdrop regarding investment sentiment and economic outlook.
Spread to worst in major Asia corporate HY markets 13
Yield to worst in major Asia corporate HY markets 13
Overall speaking, the income potential of China, India and Indonesia high yield markets remained attractive, together with the relatively high level of spread in China HY market offering opportunities for excess return generation from spread compression. However, investors may need to stay highly selective in choosing quality names with a robust balance sheet and those that could potentially benefit from policy support and economic recovery.
- As of 31 January 2023. Source: Bloomberg. China HY, India HY and Indonesia HY are represented by ICE BofA High Yield Emerging Markets Corporate Plus China Issuers Index, ICE BofA High Yield Emerging Markets Corporate Plus India Issuers Index, ICE BofA High Yield Emerging Markets Corporate Plus Indonesia Issuers Index respectively.
- As of 31 January 2023. Source: Bloomberg. Asia high yield index is represented by ICE BofA Asian Dollar High Yield Index.
- As of 31 January 2023. Source: Bloomberg. China corporate HY is represented by ICE BofA High Yield Emerging Markets Corporate Plus China Issuers Index.
- As of 31 January 2023. Source: Bloomberg. India corporate HY is represented by ICE BofA High Yield Emerging Markets Corporate Plus India Issuers Index.
- As of 31 January 2023. Source: Bloomberg. Asia HY, China HY, India HY and Indonesia HY are represented by ICE BofA Asian Dollar High Yield Index, ICE BofA High Yield Emerging Markets Corporate Plus China Issuers Index, ICE BofA High Yield Emerging Markets Corporate Plus India Issuers Index, ICE BofA High Yield Emerging Markets Corporate Plus Indonesia Issuers Index respectively.
- As of 2022. Source: REN21 Renewables 2022 Global Status Report
- As of October 2022. Source: World Economic Outlook October 2022, International Financial Statistics (IMF). [*]2022-2027 data were estimated by IMF.
- As of 31 January 2023. Source: Bloomberg. Indonesia corporate HY is represented by ICE BofA High Yield Emerging Markets Corporate Plus Indonesia Issuers Index.
- As of October 2022.Source: Indonesia Energy Transition Outlook, International Renewable Energy Agency
- As of 31 January 2023. Source: Bloomberg. China HY, India HY and Indonesia HY are represented by ICE BofA High Yield Emerging Markets Corporate Plus China Issuers Index, ICE BofA High Yield Emerging Markets Corporate Plus India Issuers Index, ICE BofA High Yield Emerging Markets Corporate Plus Indonesia Issuers Index respectively.
- As of 31 December 2022. Source: Bloomberg. Markit iBoxx USD Asia ex-Japan China Real Estate High Yield TRI
- As of 31 January 2023. Source: Bloomberg. China HY, India HY and Indonesia HY are represented by ICE BofA High Yield Emerging Markets Corporate Plus China Issuers Index, ICE BofA High Yield Emerging Markets Corporate Plus India Issuers Index, ICE BofA High Yield Emerging Markets Corporate Plus Indonesia Issuers Index respectively.
- As of 31 January 2023. Source: Bloomberg. China HY, India HY and Indonesia HY are represented by ICE BofA High Yield Emerging Markets Corporate Plus China Issuers Index, ICE BofA High Yield Emerging Markets Corporate Plus India Issuers Index, ICE BofA High Yield Emerging Markets Corporate Plus Indonesia Issuers Index respectively.
Disclosures:
Investment involves risks. Past performance of any particular fund or product mentioned in this document is not indicative of future performance of the relevant fund or product, and the value of each fund or product mentioned in this document may go down as well as up. You should not invest solely in reliance on this document. You should read the Summary Prospectus, Product Key Facts and the relevant Supplement(s) including the Special Investment Considerations and Risks section of the Summary Prospectus. There is no assurance on investment returns and you may not get back the amount originally invested.
You should consider your own risk tolerance level and financial circumstances before making any investment choices. If you are in doubt as to whether a certain fund or product mentioned in this document is suitable for you (including whether it is consistent with your investment objectives), you should seek legal, financial, tax, accounting and other professional advice to ensure that any decision made is suitable with regards to that your circumstances and financial position and choose the fund(s)/product(s) suitable for you accordingly.
The information contained in this document has been derived from sources believed to be accurate and reliable as of the date of publishing of this document, and may no longer be true, accurate or complete when viewed by you.
The content is for informational purpose only and does not constitute an offer, a solicitation of an offer or invitation, advertisement, inducement, representation of any kind or form whatsoever or any advice or recommendation to enter into any transactions in respect of the funds/products referred to in this document. This document is not intended to be relied upon as a forecast, research, or investment advice regarding a particular investment or the markets in general, nor is it intended to predict or guarantee the performance of any investment. The information does not take account of any investor’s investment objectives, particular needs or financial situation. You should not consider the information as a comprehensive statement to be relied upon. All expressions of opinion and predictions in this document are subject to change without notice.
Subject to any contrary provisions of applicable law, neither the companies, nor any of their affiliates, nor any of the employees or directors of the companies and their affiliates, warrants or guarantees the accuracy of the information contained in this document, nor accepts any responsibility arising out of or in connection with any errors or omissions of the contents set out in this document.
Indices are unmanaged and do not take into account fees, expenses and transaction costs and are not available for direct investment. Past performance is not indicative of future performance.
Dividend is not guaranteed.
This document is the property of Principal Asset Management Company (Asia) Limited that no part of this document may be modified, reproduced, transmitted, stored or distributed to any other person or incorporation in any format for any purposes without Principal Asset Management Company (Asia) Limited’s prior written consent.
Source of this document is from Principal Asset Management Company (Asia) Limited.
This document has not been reviewed by the Securities and Futures Commission.
This document is issued by Principal Asset Management Company (Asia) Limited.
Reference number: 2772894