Asia High Yield: Valuations remain attractive

Crystal Chan - Head of Investment Specialist, Principal Hong Kong
Key takeaways:
-
In the past three months as of January, Asia high yield bonds surged by over 35%, outperforming Asia IG, Global high yield and Asian equities.
-
We continue to see value in the Asia high yield market with attractive valuations. With relatively benign monetary policies across Asia, growth reprioritization in China and weakening US currency, market sentiments and technicals could be in favour of Asian bonds going forward.
Entering 2023, investment market continued its rally on the backdrop of an improving outlook towards US inflation, a decelerating pace of rate hikes in the US and the prevailing reopening rhetoric in China. As a result, fixed income assets rebounded across the board with yields coming off from relatively high levels recorded in the fourth quarter. From the end of October 2022 to that of January 2023, Asia high yield bonds surged by over 35%, which not only outperformed Asia investment grade (+7.5%) and Global high yield (+10%), but also Asian equities (+27%)1. Going forward, we expect that a relatively brighter growth prospect in Asia as opposed to elevated recession risks in developed markets, coupled with an attractive valuation, will continue to support the performance of Asia High yield bonds in the year ahead.
Why Asia High Yield
1. Resilient economic profile2
From a macroeconomic viewpoint, compared to developed markets exposed to certain recession risks, Asian economies are relatively resilient. According to the projection from International Monetary Fund in January 2023, Asia economies may expand at a growth rate of 5.3% led by the economic normalization of China and the rapid growth of India. Such growth rate is much higher than the world, Europe and the U.S. Besides, it is projected that the financial profile of the Governments in Asia will continue to beat the developed countries, with the former’s debt to GDP ratio estimated to hover around 80% during 2023-2025 compared to nearly 130% for the latter, suggesting a stronger capability of Asian countries to pay back their debts and a greater room for increasing borrowing in challenging climates.
2. Further rebound potential
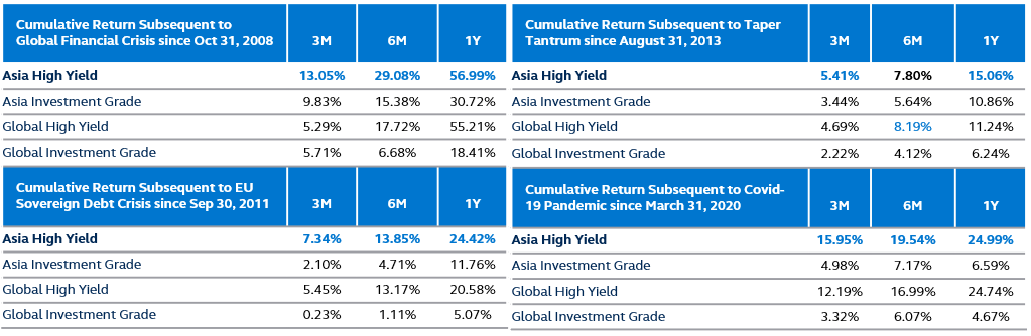
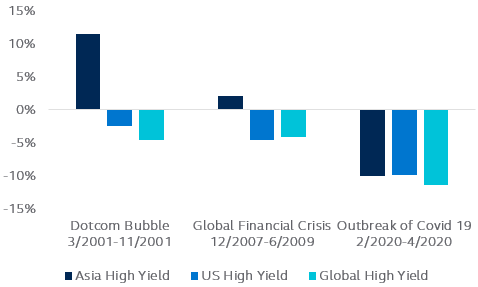
Among Asia investment grade, Asia high yield, global investment grade and global high yield, historical data showed that Asia high yield consistently gained the largest returns in 3-month, 6-month and 1-year periods after the market bottomed out in past risk events. While fundamentals turned positive and valuations stayed attractive, there is a potential of continuous rebound.
Sector performance after market crackdowns3
Numbers in blue indicate the highest returns among selected asset classes
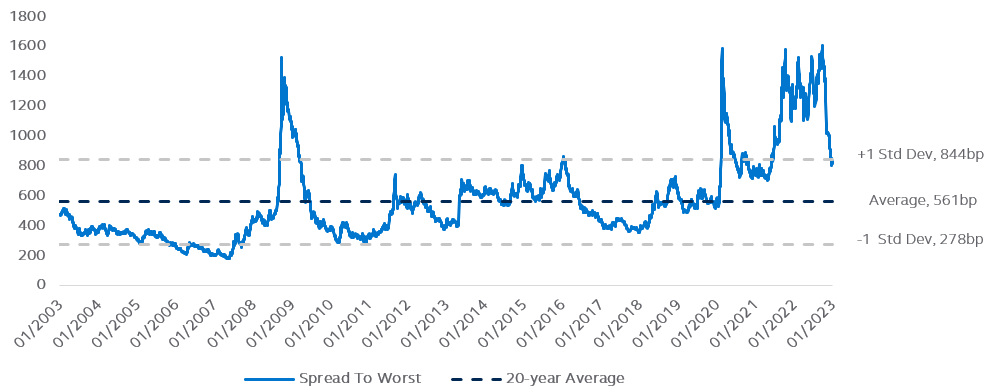
3. Attractive Valuation
From a valuation perspective, Asia high yield spreads are more than 266bps wider than the 20-year average. With recent views, Asia high yield markets appear to have bottomed and the troubled sectors are relatively manageable in size in the overall Asia high yield universe. We continue to see value in the Asia high yield asset class with attractive valuations. With relatively benign monetary policies across Asia, growth reprioritization in China, and weakening US currency, market sentiments and technicals could be in favour of the Asia market going forward. Spread in the market has narrowed in recent months with improving risk sentiment and the trend could continue to offer potential excess return from compression.
Asia High Yield Index - Spread to Worst4
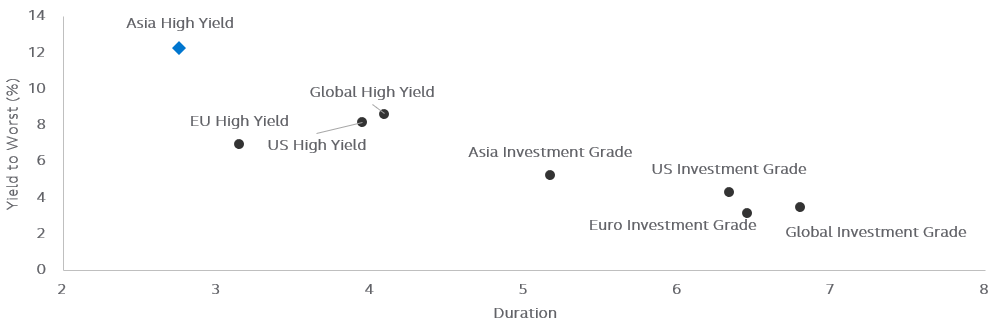
Yield to worst of Asia high yield market stood at around 12% which offered a much higher income opportunity than global and US high yield at around 8.6% and 8.2%.5 Asia high yield bonds also offered one of the shortest durations compared to other parts of the market, which could provide an extra layer of protection in a rising rate environment while the timing of Fed pivot remains uncertain. In fact, if inflation appears to be stickier than expected and the labour market continues to stay robust, a more hawkish Fed could return to the stage.
Attractive risk-adjusted income stream while the timing of a Fed pivot remains uncertain
Yield to Worst / Duration6
4. Diversification tool to navigate volatile markets
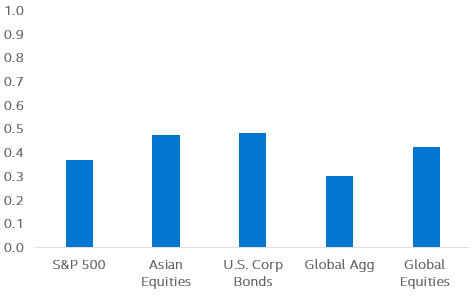
Investing in Asia high yield bonds may help diversify from the global market crackdown. The 10-year correlation of Asia high yield market with the U.S. and global equities and bonds is relatively low (around 0.3-0.5), providing exposure to a regional beta with potentially less impacts from the global market. Besides, the survivors that succeeded in weathering the downturn in the past year within the Asia high yield market tend to be relatively resilient from a fundamental perspective.
Benefited from being in a different market dynamic, Asia high yield market was proven to be an outperformer compared to its global and US counterparts during times of U.S. recessions, and managed to generate positive returns during the dotcom bubble in 2001 and the global financial crisis throughout 2007-2009.
10-year Correlation with Asia high yield index7
Performance during Recession8
With ongoing tightening policies and weakening economic data in developed markets, it is our base case that a mild recession in the U.S. can happen. Asia high yield market could achieve diversification through exposing to a different economic cycle and having greater yield buffer yet lower duration risks. While a refocus on recession can drive the market lower later this year, Asia high yield market could potentially be an outperformer given the reasons above.
- As of 31 January 2023. Source: Bloomberg. Asia high yield bonds, Asia investment grade and Global high yield, Asian equities are represented by ICE BofA Asian Dollar High Yield Index, ICE BofA Asian Dollar Investment Grade Index, Bloomberg Global High Yield Total Return Index Value Unhedge and MSCI AC Asia Pacific Excluding Japan Index.
- As of January 2023. Source: World Economic Outlook Update January 2023, International Financial Statistics (IMF). Asia is represented by Emerging and Developing Asia. 2022-2024 data were estimated by IMF.
- Source: Bloomberg. ICE BofA Asian Dollar High Yield Index, ICE BofA Asian Dollar Investment Grade Index, Bloomberg Global High Yield Total Return Index Value Unhedge, Bloomberg Global-Aggregate Total Return Index Value Unhedged USD represent Asia high yield, Asia investment grade, Global high yield and global investment grade.
- As of 31 January 2023. Source: Bloomberg. Asia high yield index is represented by ICE BofA Asian Dollar High Yield Index.
- As of 31 January 2023. Source: Bloomberg. Asia high yield, global high yield and US high yield are represented by ICE BofA Asian Dollar High Yield Index, Bloomberg Global High Yield Total Return Index Value Unhedge and ICE BofA US High Yield Index.
- As of 31 January 2023. Source: Bloomberg. ICE BofA Asian Dollar High Yield Index, Bloomberg Global High Yield Total Return Index Value Unhedge, ICE BofA US High Yield Index, ICE BofA Euro High Yield Index, ICE BofA Asian Dollar Investment Grade Index, Bloomberg US Agg Total Return Value Unhedged USD, Bloomberg Global-Aggregate Total Return Index Value Unhedged USD, Bloomberg EuroAgg Total Return Index Value Unhedged EUR represent Asia High Yield, Global High Yield, US High Yield, EU High Yield, Asian Investment Grade, US Investment Grade, Global Investment Grade, Euro Investment Grade.
- As of 31 December 2022. Source: Bloomberg. S&P 500 INDEX, MSCI AC Asia Pacific Excluding Japan Index, Bloomberg US Corporate Total Return Value Unhedged USD, Bloomberg Global-Aggregate Total Return Index Value Unhedged USD, MSCI ACWI Index represent S&P 500, Asian Equities, U.S. Corp Bonds, Global Agg, Global Equities.
- Source: Bloomberg. ICE BofA Asian Dollar High Yield Index, Bloomberg Global High Yield Total Return Index Value Unhedge, ICE BofA US High Yield Index represent Asia High Yield, Global High Yield, US High Yield respectively. Recession periods were defined by National Bureau of Economic Research (NBER).
Disclosures:
Investment involves risks. Past performance of any particular fund or product mentioned in this document is not indicative of future performance of the relevant fund or product, and the value of each fund or product mentioned in this document may go down as well as up. You should not invest solely in reliance on this document. You should read the Summary Prospectus, Product Key Facts and the relevant Supplement(s) including the Special Investment Considerations and Risks section of the Summary Prospectus. There is no assurance on investment returns and you may not get back the amount originally invested.
You should consider your own risk tolerance level and financial circumstances before making any investment choices. If you are in doubt as to whether a certain fund or product mentioned in this document is suitable for you (including whether it is consistent with your investment objectives), you should seek legal, financial, tax, accounting and other professional advice to ensure that any decision made is suitable with regards to that your circumstances and financial position and choose the fund(s)/product(s) suitable for you accordingly.
The information contained in this document has been derived from sources believed to be accurate and reliable as of the date of publishing of this document, and may no longer be true, accurate or complete when viewed by you.
The content is for informational purpose only and does not constitute an offer, a solicitation of an offer or invitation, advertisement, inducement, representation of any kind or form whatsoever or any advice or recommendation to enter into any transactions in respect of the funds/products referred to in this document. This document is not intended to be relied upon as a forecast, research, or investment advice regarding a particular investment or the markets in general, nor is it intended to predict or guarantee the performance of any investment. The information does not take account of any investor’s investment objectives, particular needs or financial situation. You should not consider the information as a comprehensive statement to be relied upon. All expressions of opinion and predictions in this document are subject to change without notice.
Subject to any contrary provisions of applicable law, neither the companies, nor any of their affiliates, nor any of the employees or directors of the companies and their affiliates, warrants or guarantees the accuracy of the information contained in this document, nor accepts any responsibility arising out of or in connection with any errors or omissions of the contents set out in this document.
Indices are unmanaged and do not take into account fees, expenses and transaction costs and are not available for direct investment. Past performance is not indicative of future performance.
Dividend is not guaranteed.
All figures in this document are in U.S. dollars unless otherwise stated.
This document is the property of Principal Asset Management Company (Asia) Limited that no part of this document may be modified, reproduced, transmitted, stored or distributed to any other person or incorporation in any format for any purposes without Principal Asset Management Company (Asia) Limited’s prior written consent.
Source of this document is from Principal Asset Management Company (Asia) Limited.
This document has not been reviewed by the Securities and Futures Commission.
This document is issued by Principal Asset Management Company (Asia) Limited.
Reference number: 2772900